(This is an excerpt from today’s subscriber-only DP Alert.)
We thought it might be a good idea to review sentiment today. It should be no surprise that investors are very bullish right now, but how bullish? Too bullish? The charts tell us one thing for sure and that is that sentiment could get even more bullish based on history. Remember that sentiment is contrarian so very bullish sentiment is not necessarily good for the market.
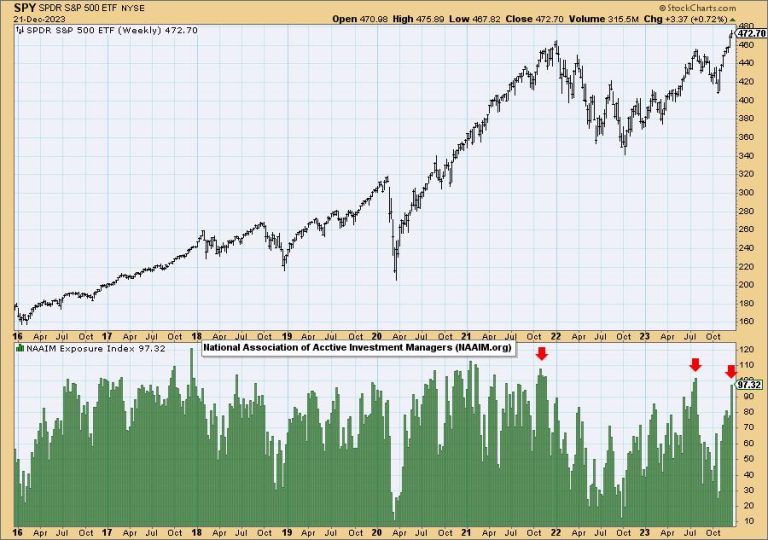
First up is the National Association of Active Investment Managers (NAAIM) Exposure Index. Those surveyed primarily use technical analysis in their processes so it is interesting to see how exposed or leveraged they are on the market. We have certainly reached exposure levels that could pose a problem given the last two readings at this level resulted in declines. At the same time, readings can get much higher than they currently are and it doesn’t always spell disaster. It is interesting to note that these analysts are very bullish, almost fully invested, but they aren’t leveraged yet.
Next up is the American Association of Individual Investors (AAII) chart. Here we see some bullish extremes as noted not only by the amount of bulls, but also shown in the Bull/Bear Ratio. These high ratios often occur before declines. The 2020-2021 rally wasn’t bothered by these high ratios and that could be the case this time around as well, but this chart tells us to not let down our guard yet.
Finally a quick peek at our Rydex Ratio chart. This is a ‘money where your mouth’ is indicator. We aren’t looking at polling results, but actual dollars. We take the total number of bull assets and divide them by total bear and money market assets. Bull assets have climbed considerably, but they aren’t at levels we’ve seen prior so there is room for expansion. However, we have to note that bull assets at this level, often times leads into a decline.
Conclusion: Bullish sentiment abounds, but it isn’t as bullish as it could get. Given the strength of the current rally we think we will see even higher bullish sentiment readings. If the 2021 rally is any indication, these sentiment measures can get extended and not result in lower prices.
Learn more about DecisionPoint.com:
Watch the latest episode of DecisionPoint on StockCharts TV’s YouTube channel here!
Try us out for two weeks with a trial subscription!
Use coupon code: DPTRIAL2 at checkout!
Technical Analysis is a windsock, not a crystal ball. –Carl Swenlin(c) Copyright 2023 DecisionPoint.com
Disclaimer: This blog is for educational purposes only and should not be construed as financial advice. The ideas and strategies should never be used without first assessing your own personal and financial situation, or without consulting a financial professional. Any opinions expressed herein are solely those of the author, and do not in any way represent the views or opinions of any other person or entity.
DecisionPoint is not a registered investment advisor. Investment and trading decisions are solely your responsibility. DecisionPoint newsletters, blogs or website materials should NOT be interpreted as a recommendation or solicitation to buy or sell any security or to take any specific action.
Helpful DecisionPoint Links:
DecisionPoint Alert Chart List
DecisionPoint Golden Cross/Silver Cross Index Chart List
DecisionPoint Sector Chart List
DecisionPoint Chart Gallery
Trend Models
Price Momentum Oscillator (PMO)
On Balance Volume
Swenlin Trading Oscillators (STO-B and STO-V)
ITBM and ITVM
SCTR Ranking
Bear Market Rules

